If you are unsure how to solve probability distribution problems in statistics assignments, then first start by figuring out what type of distribution the question is about. Next, learn the basic formulas and use them step by step. Don’t be afraid to use a calculator or get expert assignment help if needed. With practice, it gets easier.
Probability distribution is a key idea in statistics that will help you understand how random events happen. No matter whether you are a student working on a tough statistics assignment or someone learning about data, understanding probability distribution is very important. If you are clueless about how to approach probability distribution in statistics, then read this blog. Here, we have explained what a probability distribution means and how to solve related problems. Also, we have provided some expert tips to easily prepare your statistics assignments with more accuracy.
What is Probability Distribution in Statistics?
A probability distribution shows how likely different outcomes are in a random event. It will tell you the chance that a random value will be a certain number. This value can be a specific count, like the number of heads when flipping coins, or any number within a range, like the height of students.
The probability distribution is of two types. They are
- Discrete Probability Distribution: This type deals with values you can count one by one. For example, when you roll a six-sided die, the possible results (1, 2, 3, 4, 5, 6) are limited and easy to count. So, this is a discrete distribution.
- Continuous Probability Distribution: This type applies to values that can be any number within a certain range. Examples are the normal and exponential distributions, which are used in many areas like finance and biology.
Key Components of Probability Distribution
If you want to understand or solve probability distribution problems, then you must know these key parts:
- Random Variable (X): It represents a value that can change and has unpredictable outcomes.
- Probability Function: For countable values, it is called the Probability Mass Function (PMF). For values that can be any number in a range, it is called the Probability Density Function (PDF).
- Cumulative Distribution Function (CDF): It shows the probability that a random variable is less than or equal to a certain value.
- Expected Value (Mean): It represents the average value you expect. You can calculate it by weighing all possible outcomes.
- Variance and Standard Deviation: They give the measures of the spread or dispersion of the distribution.
How to Approach Probability Distribution Problems
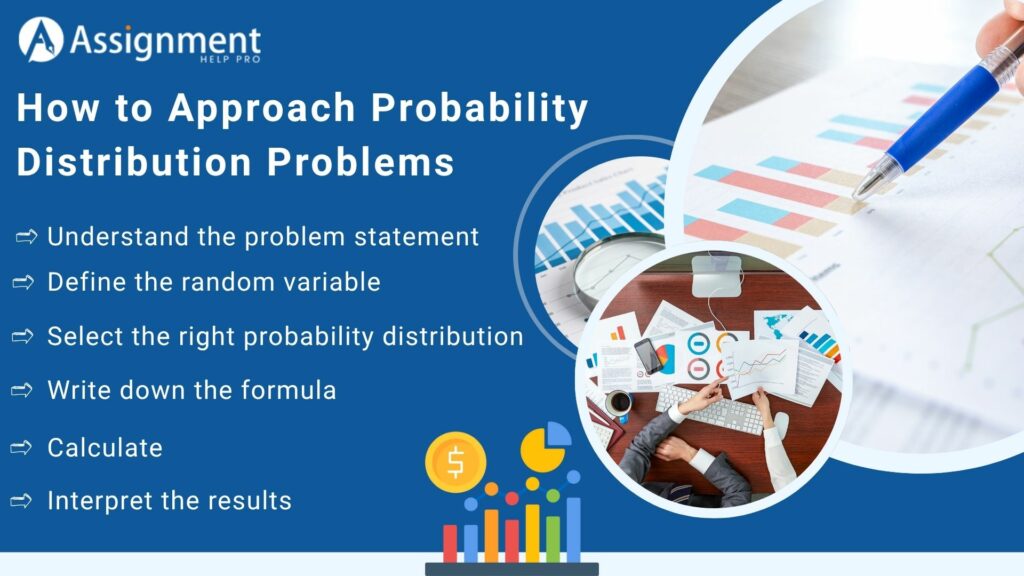
When you have probability distribution problems in your statistics assignments, follow this step-by-step method to find an accurate solution.
Understand the problem statement
Start by reading the problem carefully to figure out if the variable is countable (discrete) or can take any value within a range (continuous). Then, understand what values the random variable can have. Identify which type of distribution applies, like binomial, normal, or Poisson. Finally, be clear about the exact probability or value you need to find.
Define the random variable
Give the random variable a clear name. For example, if the problem asks about how many defective items are in a batch, you can say X = number of defective items.
Select the right probability distribution
This step is very important. Among the below-listed common types of distributions, choose any type relevant to your problem. If the problem doesn’t say which distribution to use, try to figure it out from the situation.
- Binomial Distribution: It counts how many successes happen in a fixed number of tries.
- Poisson Distribution: It counts how many times an event happens in a certain time or space.
- Normal Distribution: It describes data that clusters around an average.
- Exponential Distribution: It looks at the time between events in a Poisson process.
Write down the formula
After you know which distribution to use, write down the right formula. For example, for the binomial distribution, you calculate the probability using:
= pk (1-p)n–k
where n is the number of trials, k is the number of successes, and p is the chance of success in each trial. For a normal distribution, you can find probabilities by using a standard normal table or software. But first, you should convert your value into a standard score called the z-score.
Calculate
Substitute the given numbers into the formula and do the calculations carefully. You can use a calculator or statistical software to help avoid mistakes.
Interpret the results
Knowing what your answer means in the situation is just as important as doing the math. For example, if the probability is 0.3, it means there’s a 30% chance the event will happen.
Tips for Solving Probability Distribution in Statistics Assignments
- Learn the basics first. Make sure to understand how each type of distribution works before solving problems.
- Practice how formulas are made. This can help you use them more confidently.
- Use tools like Excel, R, Python, or online calculators for tough calculations.
- When solving probability distribution problems in statistics assignments, read the questions carefully. Don’t miss the keywords like “at least,” “at most,” or specific ranges.
- If it is challenging for you to solve any complex problem, you can get statistics assignment help or biostatistics assignment help from experts online.
Conclusion
Probability distribution is an important part of statistics that will help you understand how likely different outcomes are. By figuring out the type of distribution, learning the formulas, and practicing step by step as presented in this blog, you can handle probability distribution assignments with more confidence. If you ever get stuck, utilize our online assignment help services. The statistics assignment helpers on our platform will help you in finishing the task accurately and building your problem-solving skills.
Frequently Asked Questions
1. What is the difference between Probability Mass Function (PMF) and Probability Density Function (PDF)?
The PMF is used for discrete variables and gives the exact chance of getting a specific value. The PDF is used for continuous variables and shows how likely values are in a range. For continuous data, you don’t find the probability of one exact value, but the chance it falls within an interval by calculating the area under the curve.
2. How do I know which probability distribution to use in a problem?
It depends on what kind of data you are working with and the situation. If you are counting how many times something happens in a set number of tries, use the binomial distribution. If you are dealing with measurements like height or weight, the normal distribution is usually the right choice.
3. Can I solve probability distribution problems without a calculator?
For simple discrete distributions like binomial with small values, you can do a manual calculation. However, for continuous distributions or large datasets, it is best to use a calculator or software to save time and avoid mistakes.
4. How can I get help if I struggle with probability distribution assignments?
If you are having trouble with probability distribution, there are plenty of ways to get support. You can use online resources, ask a tutor, or get expert statistics assignment help for clear explanations and step-by-step guidance.